GSA 8(a) STARS III Pricing Tool
Do quick pricing research with this web application.
- Created: 11/06/2012
- latest Update: 9/16/2021
- http://www.gsa.gov/8astars3
What is this?
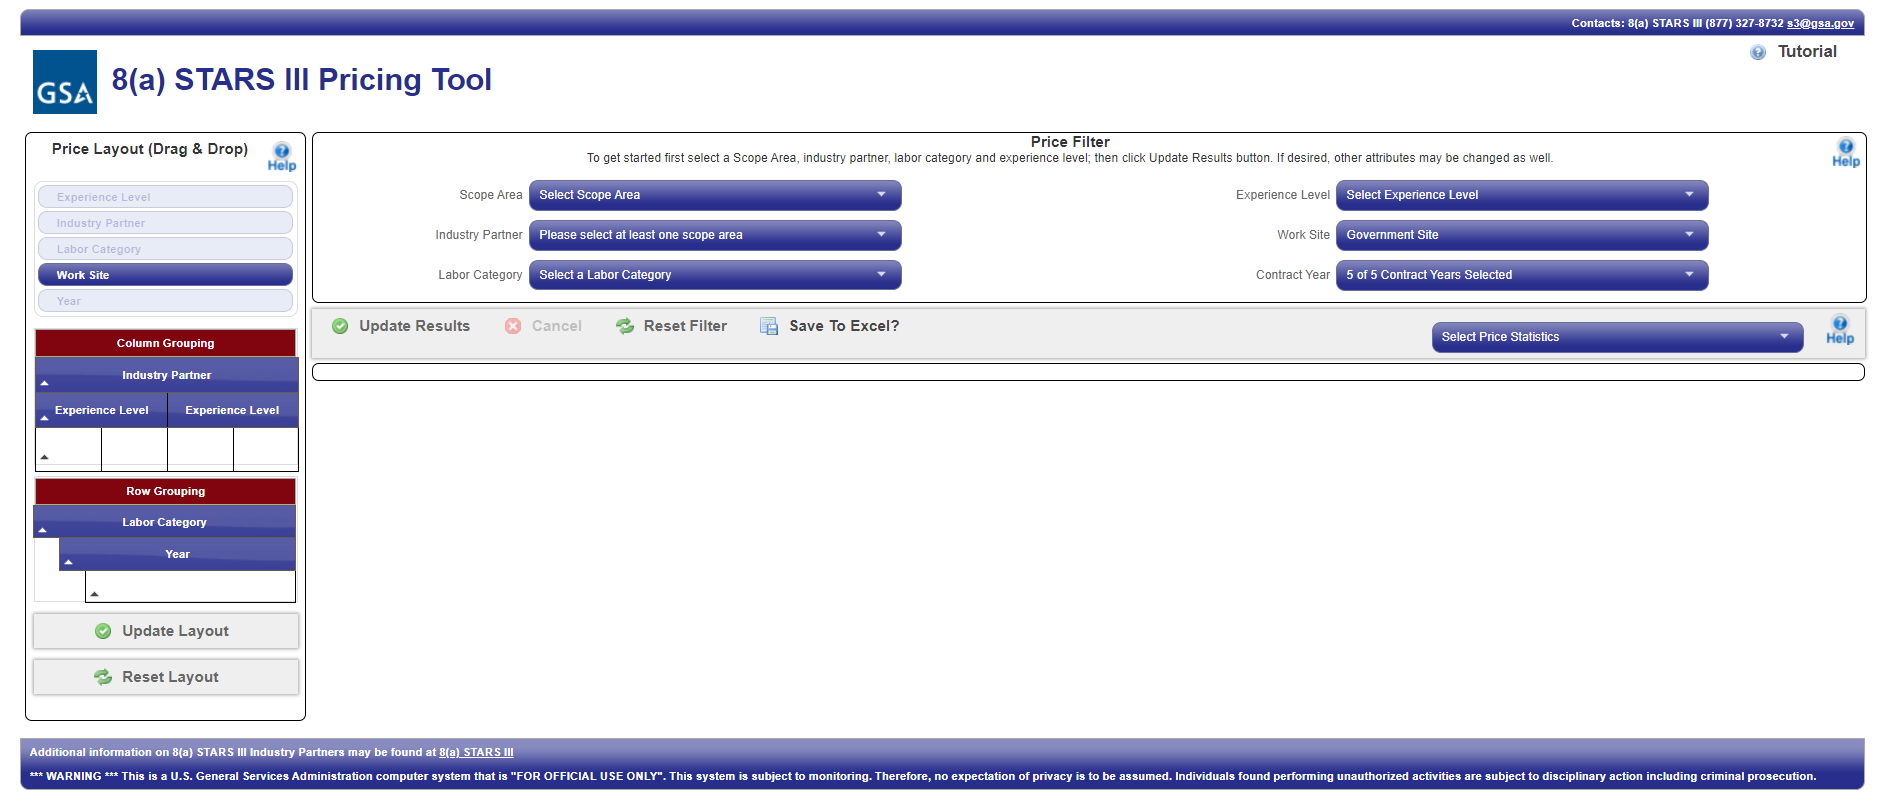
The 8a STARS III Pricing Tool
This 8(a) STARS III Pricing tool allows you to view fully burdened labor-hour pricing for 8(a) STARS III industry partners based on 8(a) STARS III data elements.
Features
Great Features in a new GSA Pricing Tool.
- Powerful - Over 233 Million prices at your fingertips.
- Downloadable Results - Download pricing results to Excel for further manipulation and/or printing.
- Great reference information - With the results, you get details on what was searched on and what filters were used.
- Data Segmentation - Get collective statistics such as high, low, average and median pricing against appropriate data.
- Drag-and-Drop-Configurable layout options - Modify the results layout. (For example, put industry partners on the rows (or X-Axis) and put labor category on the columns (or Y-Axis.)
- Contextual help - Get help on a section-by-section basis. Click the question mark icon in the upper right corner to get help specific to that section.
How this Application Works
How does the tool work? How do I use it?
- Choose your layout using the Price Layout (Drag & Drop) sidebar on the lefthand side of the screen.
- Choose the Price Filter(s) that you want to apply.
- Use the Command Bar to:
- Update your results.
- Cancel an update that's in progress.
- Reset the view, restoring all settings to their defaults.
- Save to Excel which will take any results currently displayed below the command bar, and convert them to an Excel file.
- Select Price Statistics for the data being displayed.
- Select a question mark in the upper righthand corner of a section to get help for that section.
Price Layout
Using the Price Layout workspace
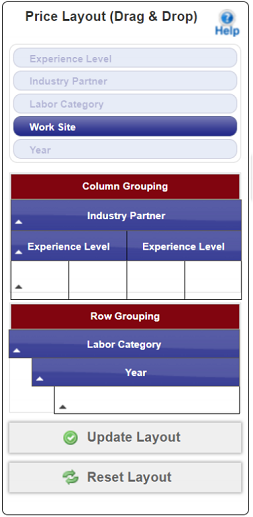 In this section, you can identify variables and changes to affect how the data will be displayed. Four major features are in this area:
- At the top of the "Price Layout Drag & Drop Area", any variable that has not been applied to Column Grouping or Row Grouping is found here. You can apply the variables found in this first area to any row or column grouping.
- Later in this section is a second area called "Column Grouping". The default variables in this area are Industry Partner and Experience level, accompanied by rows of open slots to add other variables if desired.
- The third area is dedicated to Row Grouping. The default variables in this area are "Labor Category" and "Year". One open spot remains for any other variable you wish to add.
- The fourth area is a single button called "Reset Layout". This button will move all the variables to their default positions.
The variables are:
- Experience Level
- Industry Partner
- Labor Category
- Work Site
- Year
Their default arrangement is as follows:
- Work Site is unused, and ready to be placed.
- Industry Partner and Experience Level are placed inside the Column Grouping box as the first and second slots.
- Labor Category and Year are placed inside the Row Grouping box in the first, and second set of slots respectively. (The last set of slots are empty.)
Drag-and-Drop Variables in the Price Layout Workspace
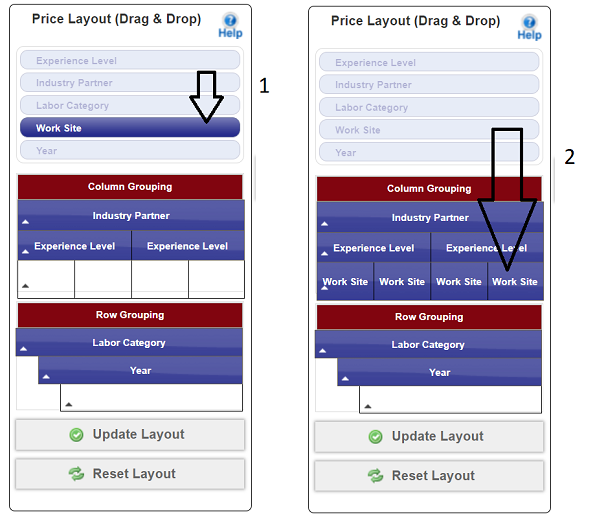 To Drag and Drop a variable in the desired spot, simply click on one of the variables to pick it up and drag to move it:
- Click and drag the Work Site variable.
- Drag it to the slot row or column you want it in.
- Select the appropriate filters, if you haven't done it already.
- Then, click the Update Layout button to see the data within your new layout.
Other drag-and-drop features are:
- Variables already placed in the column and row grouping boxes can be "ungrouped" by dragging them back to the attribute palette.
- Any Variable can be swapped for another variable by dropping one variable on top of another.
- Variables can be freely moved using drag-and-drop into the order you desire.
What an updated layout looks like
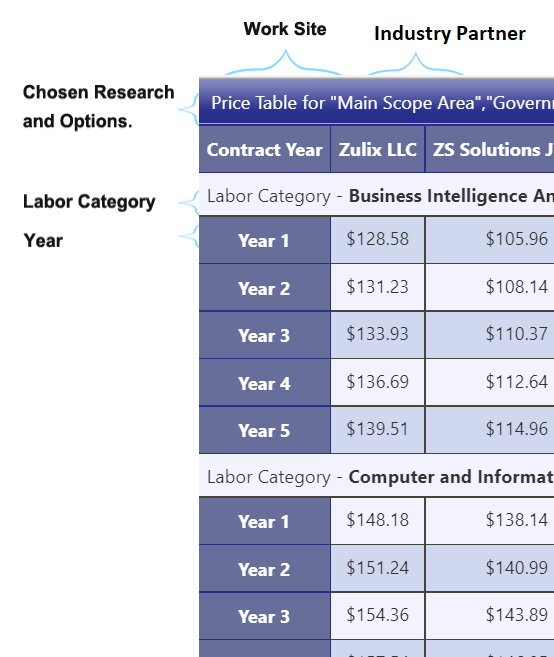
An updated layout should look like the image above.
Why are the columns in the Columns Grouping box subdivided?
They are subdivided simply to show that you may view more than one variable as a column heading within the layout.
How can I change the sorting order on variables?
Clicking the ascending or descending indicator can reverse the order of how attributes are sorted within the layout.
For example: If the third attribute to group by is “Year”, you can set the years to appear in alphanumeric ascending or descending order.
Price Filter
Working with the Price Filter workspace
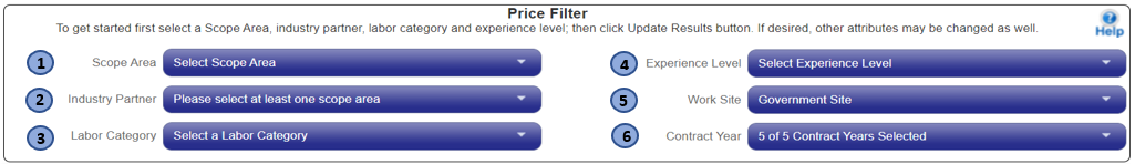
The price filter workspace consists of the following filters:
- Scope Area - Select one of the awarded Scope Areas.
- Main Scope Area - contains industry partners that are technically proficient for contract opportunities that do not require Emerging Technology or OCONUS experience.
- Scope Sub-Area 1: Emerging Technology-Focused IT Services - This sub-area provides IT services-based solutions which involve emerging technology innovation to securely accelerate transformation and advance mission outcomes.
- Scope Sub-Area 2: IT Services performed outside of CONUS - This sub-area provides IT services-based solutions to be performed outside the contiguous United States (OCONUS).
- Industry Partners - Industry partners meeting the Scope Area filter selected.
- Labor Categories - Labor categories established in the 8(a) STARS III GWAC.
- Experience Level - Experience level of the labor category.
- Junior
- Journeyman
- Senior
- SME
- Work Sites - Choose one of two available sites: contractor or government site.
- Contract Year - Labor rates have been established for the contract base period. Select the pricing years you'd like to see. For pricing beyond contract year 5 please contact the 8(a) STARS III team at s3@gsa.gov
- Contextual Help - Click on the Help button to get brief help text for this section.
Features within a dropdown option list:
- Check all - This feature allows you to select all the options currently within the dropdown list.
- Uncheck all - This feature permits you to de-select all the options currently within the dropdown list.
- A Filter with a text box - This powerful feature allows you to narrow your choices. Type in the text box what you'd like to narrow the options down to. In the example to the right, the option list is being narrowed down to just a few options that contain the text string "cap". When you use this feature, it affects only the items that are in the dropdown. (i.e., the filtered dropdown items only)
Here are the steps for using the dropdown option list to filter the options themselves:
- Select the dropdown.
- Click inside the text box provided with the filter.
- Then, type the text you'd like to filter on. If you type something in the text box and your string matches (even partially) one or more options, the dropdown list will only show those options that match what you have entered.
- You can select/unselect all of the options if you have no text in the filter text box by clicking "check all"/"uncheck all" inside the dropdown list.
- If you type something in the filter text box and your string matches (even partially) one or more option items, the dropdown list will only show those options that match what you've typed.
You can then:
- Toggle your selection for those items by clicking on them individually.
- Select all of the matched items but nothing else by clicking on "Check All".
- Un-select all of the matched items but nothing else by clicking on "Uncheck All".
For Example, if you want to select only a few items out of all the available options,
- Remove any text from the text box to see all the possible options.
- Choose "Uncheck all" to clear any previously selected items.
- Type in the text box. You will notice that the selections in the dropdown list will start showing only the options that are matching your filter string.
- If you have found what you're looking for, you may click "check all" to select only those items that have matched your criteria.
Similarly, if you want only a few items unselected out of all the available options,
- Remove any text from the text box to see all the possible options.
- "Check all" to select all the items available in the dropdown list.
- Type in your filter criteria in the text box. The selections in the dropdown list will start showing only the options that match your filter string.
- If you have found what you're looking for, click "uncheck all" to deselect only those items that have matched your criteria.
Command Bar
The Command Bar in a normal state:

The Command Bar letting you know you should update the view:

The Command Bar's features include the following:
- Update - Select this to update the screen's data. If you change any aspect of layout, filtering, or statistics you'd like to see, select Update.
- Cancel - If you have started a search you'd like to stop, then select this.
- Save to Excel? - This button allows you to save your data to an excel file.
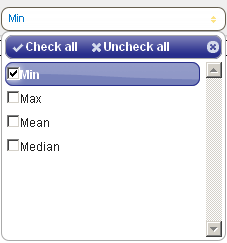
- Statistics Options - The tool processes up to four statistics if these options are selected: Minimum, Maximum, Mean and Median pricing. By default, these stats aren't computed as part of the data. Just de-select what you'd like to remove from the results.When selected, the statistics being displayed are only applicable to the selections made in the Price Filter section.
The statistics options dropdown:
Section 508 Support
The following tips and workarounds may be helpful for individuals using assistive technology with this tool. Request for accessible dashboard content may be directed to s3@gsa.gov
Recommended JAWS Version: 14
- When using the Choose Scope Area dropdown, the first item on the list is "Select Scope Area" and the radio button is checked for this first item. This might make the user think a choice has been already made -- it hasn't. The user is suggested to select Main Scope Area, Scope Sub-Area 1 or Scope Sub-Area 2.
- On the Control Bar, while Updating the Pricing List: When the user clicks the update button to get results from the tool, the user may hear the text for the 'Update Button' a second time, along with other buttons (cancel, reset, download excel, click for help, price statistics and then the word "Unavailable"). These buttons are being read inadvertently -- The system is actually processing the user's request, and the results should be available shortly. In the meantime, the user can ignore the re-reading of the buttons.
- Some users of JAWS have indicated that when using an arrow key to move through the items on a dropdown form, the screen reader will read the graphics on the button, and then it will also read the button name twice. The users can ignore the multiple successive mentions of the same button name.
- When using an arrow key to move through the items on drop downs "Labor Category" or "Industry Partner", the JAWS tool will read "To select press Space Bar" but the user needs to use the "Enter" key to select the items in the drop down.
Notes on Audible Cues:
Tips on Drag & Drop Features:
Use the following instructions to drag and drop attributes so that user can modify the column/row groupings of the reports.
- Navigate through the web site until the following instructions are heard "Price Layout left parenthesis drag and drop right parenthesis". This indicates that the virtual cursor is in the price layout area where drag and drop features can be used to create a layout for the pricing table.
- Navigate further to hear "List of four items". This indicates that the virtual cursor is in the list of attributes that can be dragged. Work Site is the draggable attribute that is available for dragging by default. The other attributes have already been arranged.
- To initiate dragging the selected attribute, first route the PC cursor to the virtual cursor. This can be achieved using the keys Insert + control + delete.
- Next route the JAWS cursor to the PC cursor (essentially this will bring the JAWS cursor to the location of Virtual Cursor). To achieve this use the keys Insert + Num Pad Minus.
- Now the JAWS cursor is on the attribute that needs to be dragged. To initiate dragging, use the following keys control + Insert + Num Pad Slash. At this point dragging has been initiated.
- The next step involves getting to the location where the attribute needs to be dropped. To do this, switch back to the virtual PC Cursor using the key Num Pad Plus.
- Now continue navigating, using down arrow key until "Column Grouping" or "Row Grouping" is heard, navigate further to hear the instructions - "Drop an element from above to form a top level row grouping. Drag an existing element to another location to change grouping. Drag an existing element back to the attribute palette above to ungroup". This instruction indicates that you can drop the attribute that was selected above for that top level column grouping. There are three levels of column grouping and three levels of row grouping. If this is the desired location to drop the attribute that was selected above, then follow these instructions.
- Navigate further until the following instruction is heard "Click to sort descending or ascending".
- Now the virtual PC cursor is on the location where the attribute can be dropped. At this point, route the PC cursor to the Virtual cursor using keys Insert + control + Delete.
- Next route the JAWS cursor to the PC cursor using keys Insert + Num Pad Minus
- Next drop the attribute using the keys control + Insert + Num Pad slash
- These instructions can be repeated for dragging and dropping other attributes.
Need Help?
Need more help? We can help you:
- Reach out to us via email - s3@gsa.gov